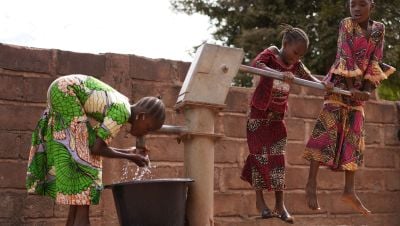
New data revealing disparities in access to water and sanitation by ethnic group offer a powerful tool to help policymakers, program managers, and advocates take action to leave no one behind — the transformative promise of the 2030 Agenda for Sustainable Development and a central focus of USAID Samantha Power’s vision for inclusive development.
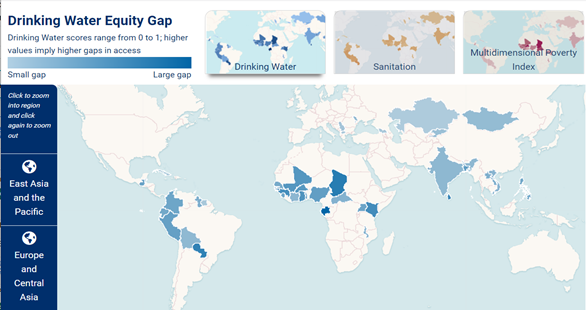
USAID is making water and sanitation equity data from the 2021 report on the Multidimensional Poverty Index (MPI) available on the Global Waters website to encourage their use.
“We want to elevate this dataset so it can be used to address the gaps that marginalized people face,” says Brian Banks, WASH Analytics and Data Advisor with USAID’s Center for Water Security, Sanitation and Hygiene.
The MPI measures poverty using 10 indicators of deprivation, including lack of access to improved drinking water and sanitation (see Box 1). For the first time, this annual report from the United Nations Development Programme (UNDP) and the Oxford Poverty and Human Development Initiative disaggregates all of those indicators by ethnic group, race, or caste (available for 41 countries).
Most of the surveys included similar questions about ethnic group or tribe (e.g., Senegal), enhancing comparability, but a few focused instead on racial categories (Cuba), caste (India), or a combination of ethnic group and native language (Paraguay) (see Figure 2).

The ethnicity of the head of household was assigned to all members of a household because every survey collected that information but only a few surveys collected ethnicity at the individual level. UNDP Statistics Specialist Cecilia Calderón, who performed the disaggregation by ethnicity, notes that reliance on information about heads of households is a potential limitation of the data. However, the results of a sensitivity analysis conducted for four countries that did collect data for all household members found that both approaches yielded similar results.
Identifying equity gaps
Catarina de Albuquerque, the Chief Executive Officer of (SWA), says the water and sanitation equity data help fill a need for more accurate, reliable data on who is being left behind. “Many countries don’t know who is being excluded from accessing water and sanitation services or why they are being excluded,” she says. “It’s very easy to focus on averages, because they allow you to [ignore] entrenched discrimination against certain population groups.”
The sector has made progress in understanding how marginalization affects access to water and sanitation, looking at differences by gender and urban versus rural areas, for example. However, having data disaggregated by ethnicity makes it possible to understand who is marginalized with greater precision.
For the MPI, a person is considered deprived of sanitation if they are living in a household where the sanitation facility is unimproved or it is improved but shared with other households and deprived of drinking water if they are living in a household whose source of drinking water is not improved or improved drinking water is a 30-minute or longer walk from home, roundtrip.
A country’s equity gap represents the difference between the groups with the least and highest access to drinking water or sanitation.
Using data to drive change
USAID is using visualizations like these to promote the use of the dataset in program design, implementation, and evaluation. Moving forward, the Center for Water Security, Sanitation, and Hygiene will support USAID missions to use the data to design programs that help improve equitable access to services. These data can also help USAID realize its vision of inclusive development.
SWA considers the dataset an important advocacy tool that should be used by international and bilateral organizations, human rights advocates, and journalists to encourage policymakers to address inequalities through their policies, plans, and budgets.
The data are a stark reminder that countries will not achieve the Sustainable Development Goal 6 of safe water and sanitation for all by 2030 without bringing people who have been marginalized to the forefront.
This article originally appeared USAID’s Global Waters Medium
“It opens the door for more people to think about whether their programs are actually addressing marginalized communities, because they can examine more substantive dimensions of marginalization,” Banks explains. “And that creates opportunities to reduce some of the systemic factors that have led to lack of access.”
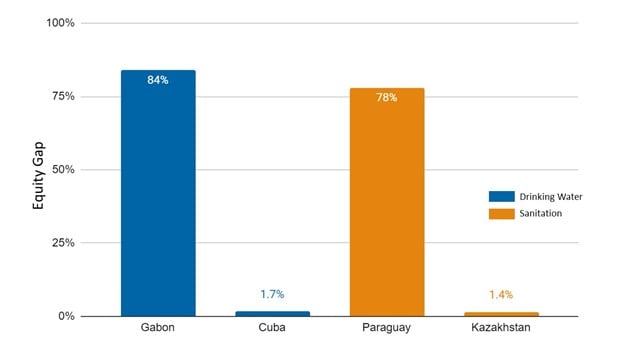
The disaggregated data reveal the degree of disparity in access to water and sanitation among ethnic groups in each country. Data visualizations created by USAID’s Center for Water Security, Sanitation and Hygiene show that the national “equity gap” between those who are most deprived of access to drinking water and those who are least deprived ranges from 84% to 1.7%; for sanitation, the range of national equity gaps is 78% to 1.4% (Figure 3). Explore more comparisons across countries and regions.